
A few months ago, we described how we fixed three different OOM scenarios in our ongoing migration to the Bazel build system here at Snowflake. Things had been sailing along just fine since then… but a new issue showed up recently: our IntelliJ with Bazel (IjwB) Java project started showing OOMs during its sync phase.
The reason this issue surfaced now is because, as we continue our migration to Bazel, our IjwB project has grown in size. Months ago, our project only covered a Java binary, but now that we have migrated all of its unit and integration tests as well, the project covers them too. It is common for tests to be more expensive to build and run than the binary they validate—tests depend on the binary’s dependencies plus many other helper tools for testing—and these caused the project to grow too big to fit in our development environments. Or did they?
Context-setting
We run Bazel in a memory-constrained VM. We do this intentionally to support our varied fleet of corp laptops: our new hires get top-of-the-line M2 Max Macbooks, but a substantial number of developers are a few months away from a hardware refresh and may not have as much RAM.
Up until now, giving a 4GB max heap to Bazel had been plenty to build and test our codebase. But, remember, things weren’t always this way: about a year ago, during our initial onboarding of remote execution, we had to bump the max heap size to 12GB. This bump was not sustainable due to the VM memory limits, and these limits forced us to pause and analyze why we needed much more RAM than the previous build system for similar user flows. This principled approach led us to find the right knobs in Bazel to make it run within the more reasonable 4GB limit and thus we avoided bumping up the resource requirements of the VM.
Syncing our project in IjwB is another one of those situations where a constrained environment has been beneficial to discover inefficiencies and fix them in a way that doesn’t require wasting everyone’s resources. The naive solution to our problems would have been to increase Bazel’s max heap to 12 GB again with a corresponding bump in the VM memory allocation, telling all engineers with older laptops to refresh them. But… that’d have been expensive and, worse, it would have left a sour taste for the ongoing Bazel migration.
So the question was: if a max heap of 4GB was sufficient to build and test all of our codebase… why did we need three times more memory “just” to sync the IjwB project? Our project is big… but not that big.
IjwB project syncing and sharding
Project syncing in IjwB is an expensive operation. What this process does is build the project’s targets with a Bazel aspect provided by the IjwB plugin. This aspect attaches to the targets defined in the project file and extracts the information that the IDE needs to index them. This aspect is expensive in terms of memory consumption and was expected to throw off our earlier predictions on Bazel’s max heap needs.
That said, because this aspect is known to be expensive, IjwB provides a feature to shard the syncing process in an attempt to reduce peak memory consumption. The idea behind project sharding is to make IjwB run the sync process on smaller sets of targets at a time instead of on the full project at once. For example, if the project specifies //server/... as the target pattern to sync, IjwB will query all targets beneath //server/..., divide them into roughly-equally sized groups, and then sync those groups separately instead of passing //server/... to a single Bazel invocation.
This feature was originally designed at Google to help with syncing gigantic targets in their monorepo, and it worked nicely for them. But, for some reason, it did not work for us. We tried multiple sharding settings and Bazel would still OOM. The key difference between our setup and Google’s was the memory constraint on Bazel’s max heap: we set this to 4GB while Google typically runs Bazel on powerful workstations with memory to spare and thus much higher max heap sizes.
Could we do anything about it?
Profiling
To understand what was going on, we had to profile heap usage. Here is a first look into Bazel’s memory consumption as displayed by VisualVM for the duration of the IjwB project sync. This run was done with about 8 shards and a max heap of 12GB to try to measure the “worst case” scenario for our build:
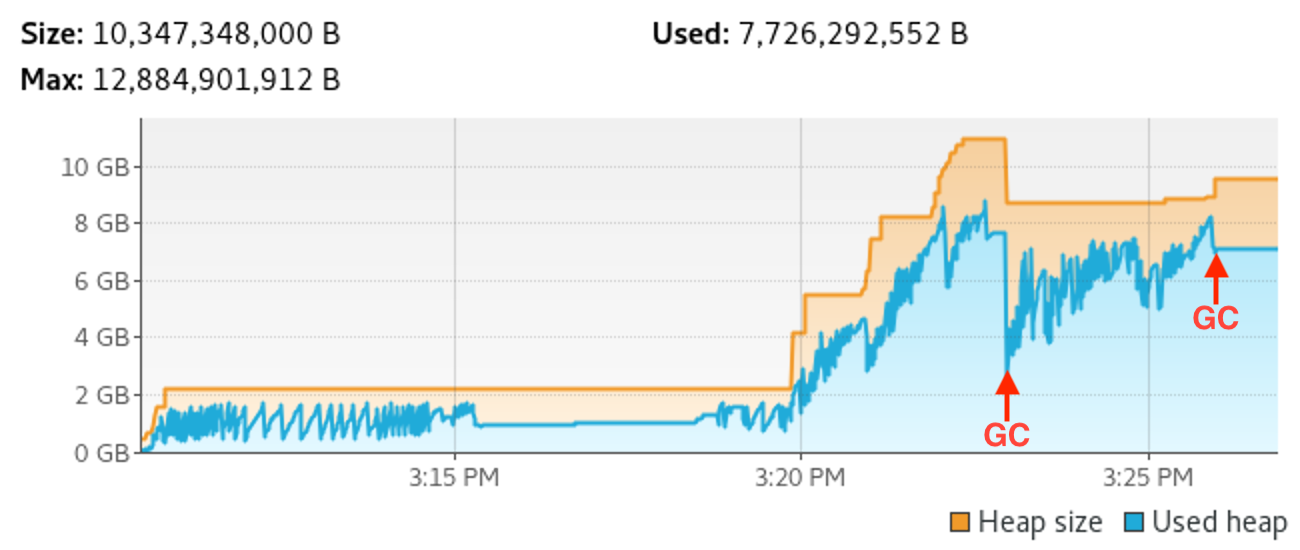
What’s interesting to note about this profile is that memory consumption grows over time and that JVM Garbage Collection (GC) cycles cannot bring it down to the initial low baseline. More importantly, the GC cycle after the sync steps complete still leaves the Bazel process consuming about 7GB. Based on this data, a small heap of 4GB seemed unfeasible given that Bazel wanted to retain much more memory than that. But… this was surprising because sharded syncing should have kept memory usage low. So, was this memory consumption legitimate or a memory leak?
To answer this question, I had to peek into a heap dump that I captured in VisualVM after one of the first shards completed syncing. I did this at the beginning of the process and not at the end to try to keep the dump small, but regardless, I ended up with a 5GB dump.
Opening the heap dump in a visualization tool was its own odyssey, which I expected going in due to the dump’s size. Eclipse Memory Analyzer (MAT for short) is a highly recommended tool, so I tried to open the profile in it. After more than an hour, however, MAT wasn’t able to finish. Looking a bit more into this, I found that MAT was configured with a 1GB max heap… and thus the JVM was GC-thrashing. Bumping—hah, the irony!—the MAT’s max heap to 8GB was sufficient to let it open the profile in just a few minutes.
Upon opening MAT and asking for a Suspected Leaks report, here is what I faced:
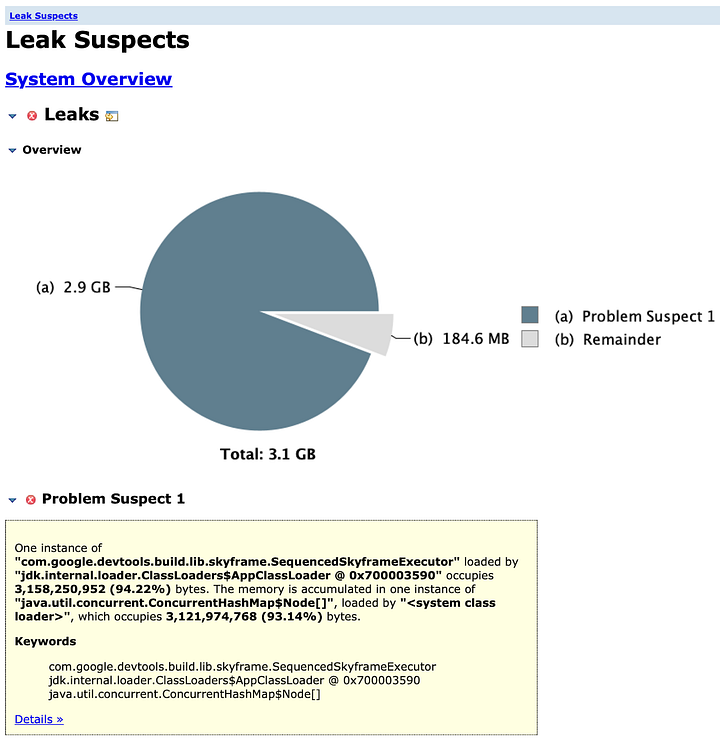
Based on this initial data, we can see that Skyframe—the thing that holds Bazel’s in-memory graph and performs operations on it—is holding onto the retained memory. But MAT is awesome! We can click on Details to dig further:
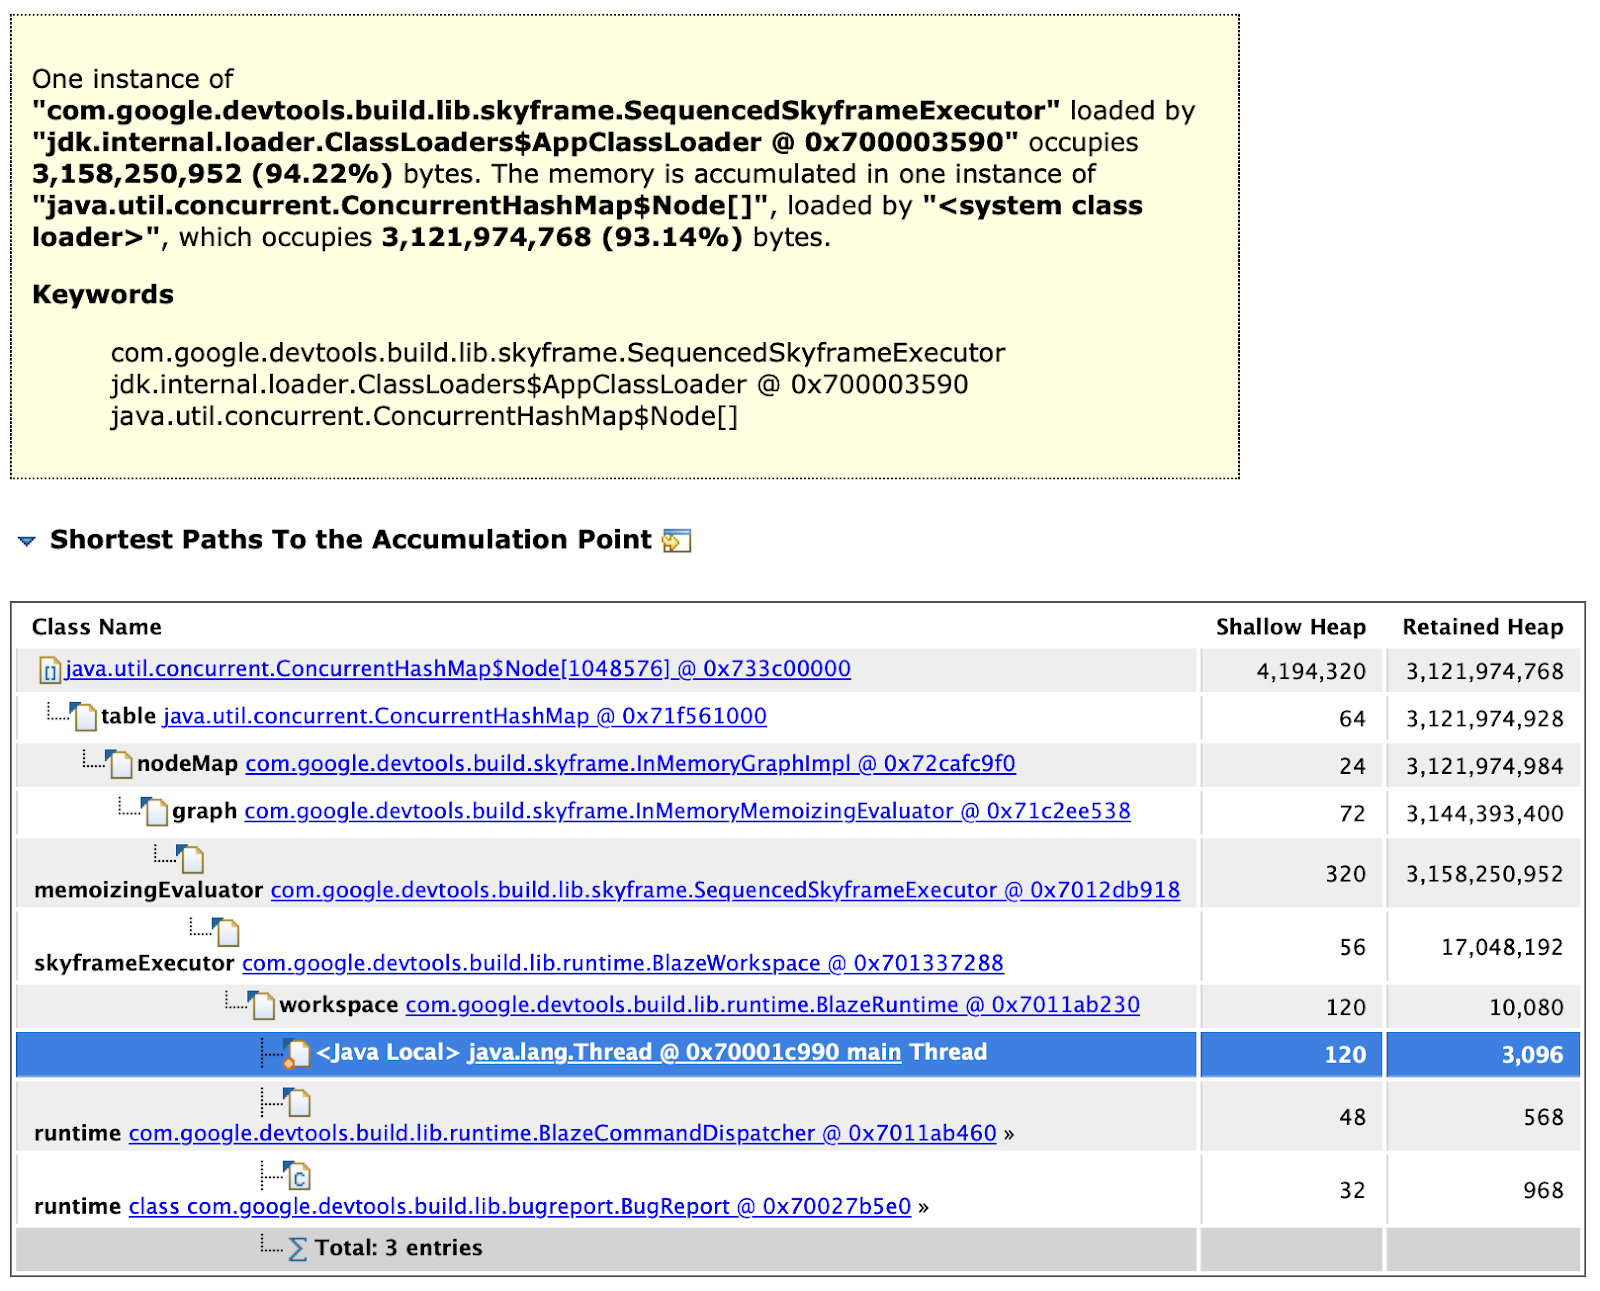
And finally, we can right-click onto the Skyframe executor object retaining those 3GB of RAM to dive into the objects hanging from it:
What we see here is that below the Skyframe graph instance, memory consumption is smeared all over the place. This makes sense: Skyframe is a graph engine so memory usage will be distributed across all nodes that the engine maintains. Some of those nodes will be heavier than others, but we should expect to see a reasonably even spread.
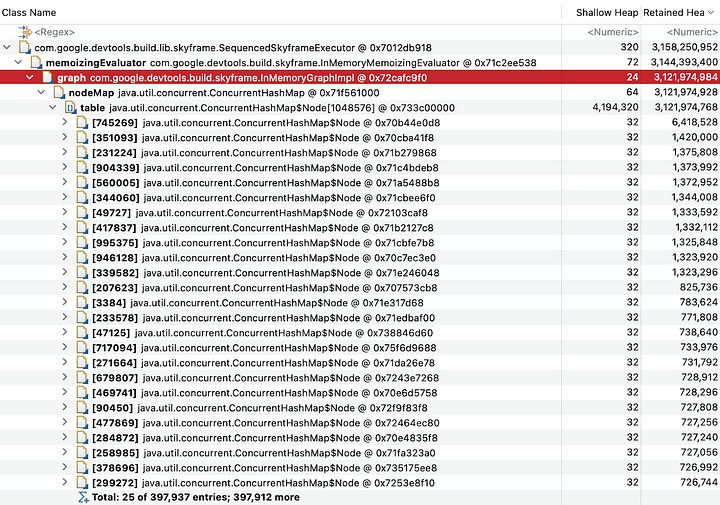
While poking through these entries, I reached a node that claimed SourceArtifactCache was retaining most of the memory. In retrospect, this conclusion was wrong because SourceArtifactCache was holding onto about 3,000,000 bytes, which was three orders of magnitude smaller than the total used memory… but I misread the numbers and thought they were the same. That was a fortunate accident though. Looking through the source code for the SourceArtifactCache, I found that it is only discarded when the analysis graph is discarded in full. And looking a bit further, I found the --discard_analysis_cache flag to forcibly discard this cache.
Bingo. By adding --discard_analysis_cache to the sync_flags list in the IjwB project definition, I could observe the following behavior during the project sync, still with a 12GB max heap:
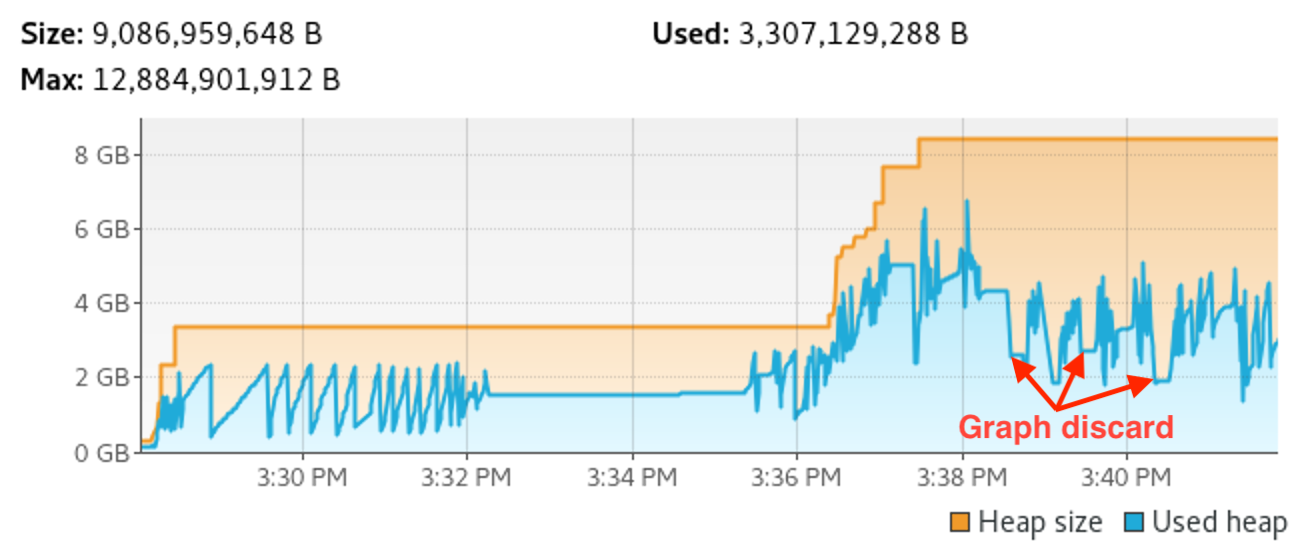
Note the clear memory consumption drops that happen after every shard finishes syncing and Bazel discards the analysis graph. Furthermore, we can see that peak memory usage now hovers at around 4GB throughout the process, which is much better than the previous 8GB. This means that combining this flag with the sharded project sync in IjwB could lead to the initial promise of reducing memory usage by using sharding.
Knowing this, the final question was: is the memory used above 4GB throughout this process retained, or is it memory that could be discarded by more frequent GC activity? In other words: if we clamp the max heap back down to 4GB, will GC kick in and maintain Bazel under it? Here is the answer:
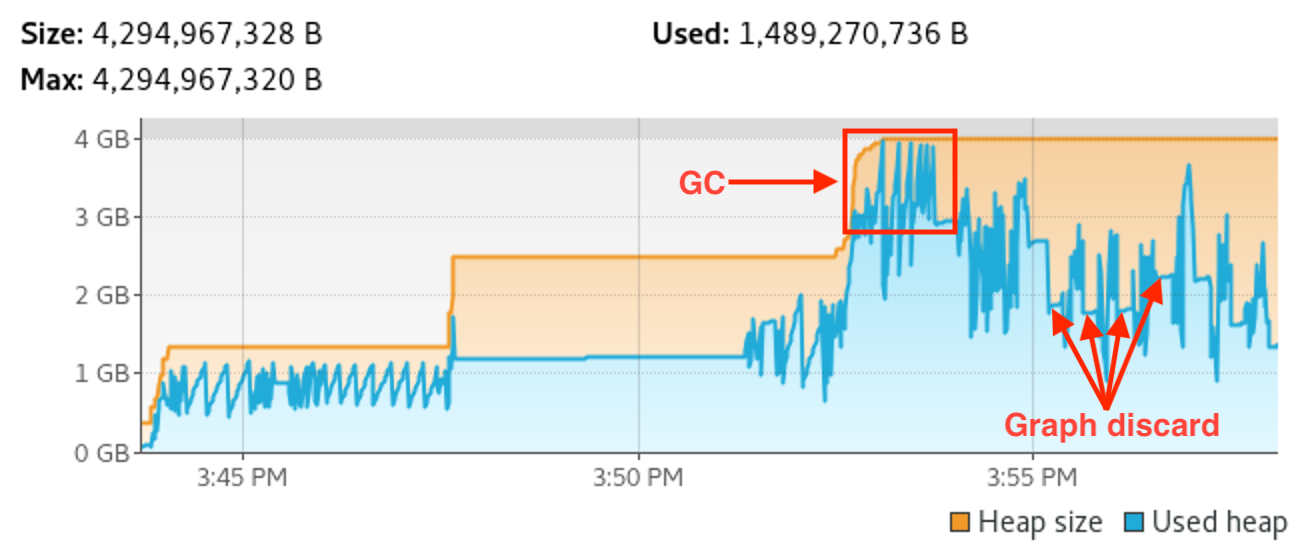
Voila. GC struggled to keep up for a brief period of time as shown in the picture, but the whole project sync process was able to complete and remained at around 2–3GB throughout.
The GC churn depicted here is still not great but it’s only a deficiency of our sharding approach. I mentioned at the beginning of the article that IjwB is in charge of project sharding, but that was an oversimplification. Due to an issue in the IjwB plugin, we have had to temporarily implement our own sharding strategy, and our sharding causes one of the initial shards to be larger than the others. We expect to see better behavior once we switch to the plugin’s built-in sharding strategy now that the issue has been fixed.
Takeaways
The obvious takeaway from all of this is: if IjwB’s sharding feature is insufficient to let you sync large projects under a tight memory constraint, try to pass --discard_analysis_cache in sync_flags and see if it helps. This may let you lower your overall Bazel memory footprint, freeing resources for other processes.
But what’s more interesting is that while environments with tight memory limits are annoying to deal with, pausing to analyze why new Bazel-based workflows seem to need more memory than legacy ones can help identify alternative solutions. In the previous article, we found how to keep Bazel’s memory under control when handling hundreds of remote build actions, and in this article, we found how to tame memory usage during IjwB project syncs. While dealing with these issues is tricky, it is crucial to address them during a build system migration to increase trust in the new system.
To conclude, let me say that memory-constrained scenarios like ours are not common and that Bazel is already doing the right thing in the common case. That doesn’t mean there is no room for improvement, so we filed bug #19412 to start a discussion. The upstream Bazel developers confirmed that they are working on optimizing memory consumption and also suggested that we try other flags such as --notrack_incremental_state. Furthermore, there might actually be undiagnosed inefficiencies in the aspect that IjwB uses to sync the project. Watch that bug for further developments!
