
The computers of yesteryear had this little feature known as blinking LED lights 🔆. They also had this other feature called noisy disks 💾 and loud fans 🪭. Uh wait. Features? Why “features” and not “annoyances”?! 🧵👇

You see, these bright lights and loud noises acted as canaries 🐦 in a performance mine. They gave developers a chance to notice when things were off performance-wise. If your code abused the CPU or the hard disk by mistake, you could tell right away.
Nowadays, developer machines tend to be quiet under heavy load, and the vast majority of laptops don’t even have lights anymore. The obvious example are Macs: they haven’t had hard disk LEDs for a really long time, and since the M1, they are silent and cold too.
These characteristics are nice from a usability perspective. Unfortunately, as a developer, you now need to first imagine that something is wrong before even deciding to look for a problem. If the thought never crosses your mind, then you may never look.
Let me give you a few examples of the kinds of inefficiencies that I’m talking about. These would have been trivially noticed by the presence of indicators. These are all based on real-world situations I faced at some point in the (recent) past.
🪵 In a project I worked on, our development builds started writing about 80 MB of log messages per second to disk. No matter how you look at it, that’s a lot of disk traffic, and yet… the problematic code passed code review and was merged into the main branch.
The only indication that something was wrong was when other developers came asking for help because their local disk space was running out faster than usual. There was no other symptom behind the problem.
You’d hope that this inefficiency would be caught while qualifying the new release for production because, in theory, such logging waste would translate in an increase in CPU consumption or network bandwidth. But… I’m not so sure the issue would have been noticed.
🌐 In another project I worked on, I noticed that Bazel took an incredibly long time to complete some actions. It wasn’t until I looked in detail that I saw it stuck in a loop fetching the same remote artifact over and over again due to connection resets.
The build completed successfully after many minutes once Bazel gave up on the downloads and fell back local execution. There was no reason to suspect that something was wrong other than “these actions are just huge”. In reality, though, there was a bug somewhere.
🧱 Just today, I was in a video call and noticed that my laptop was reading 100MB/s from disk non-stop. I concluded the meeting but the disk reads didn’t stop. A quick peek at
topshowed something calledWallpaperVideoExtensionthat seemed to have gone rogue.This background process was consuming one full CPU, but such load wasn’t enough to make the system feel slower nor noisier. I suppose I would eventually have noticed that the battery was running out quicker than usual, but maybe not.
Killing the process made the problem go away and the constant disk reads stopped. Looking online, I find other instances of
WallpaperVideoExtensionconsuming lots of CPU and memory, so this seems to be a bug. But if it’s common, why wasn’t it noticed in the first place?
In any case, this last scenario gives you a hint 🔍 as to where I’m going: how did I even notice this last problem? After all, my M1 Mac was working just fine: it was just slightly warmer than usual but there was no loud fan noise nor lights to tell me about disk activity.
The answer is simple: I have an omnipresent performance monitor in my screen that shows CPU load, memory pressure, disk I/O throughput, and network traffic. This monitor is always visible, taking little space in the menu bar or the task bar.
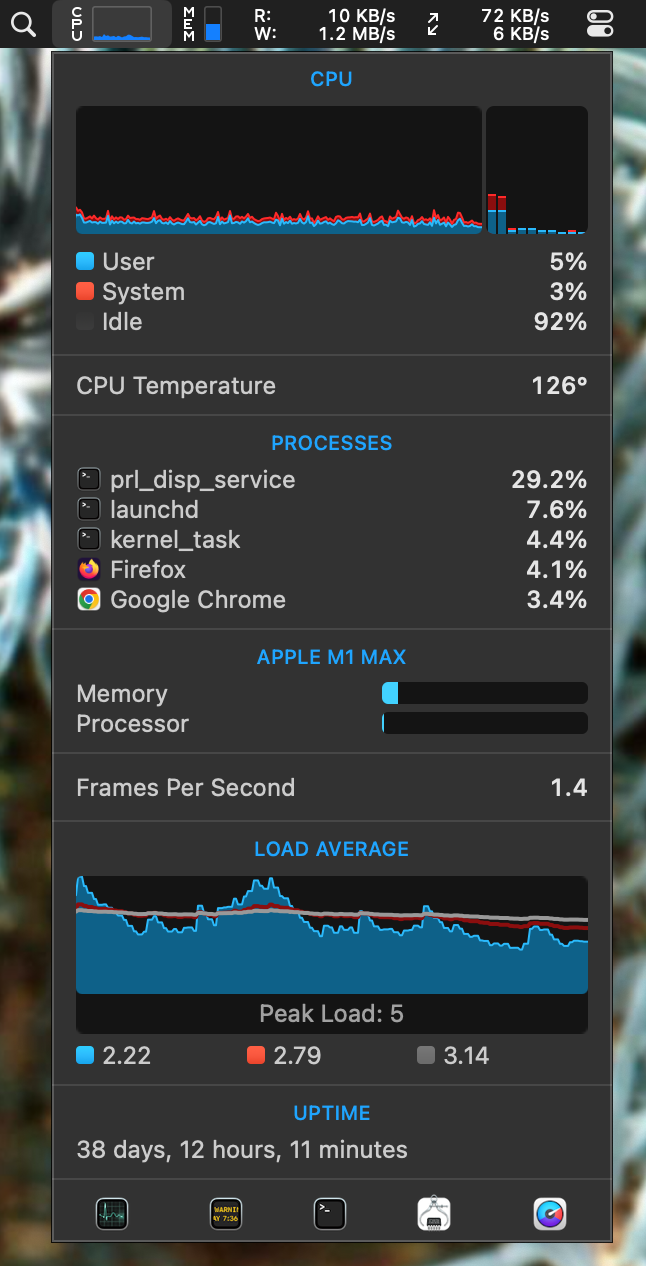
Every time I sense something is a tiny bit off, I glance 👀 at the monitor. You cannot imagine how many times I’ve gone “huh, that’s interesting” by seeing unexpected activity and then went on to discover big performance problems somewhere in the system.
My recommendation is that you stop what you are doing and go and install such a performance monitor right now. I’d even argue that having one always visible should be a hard requirement for any development machine and corp IT departments should preinstall one.
Personally, I’m a huge fan of iStat Menus for macOS and have been using it for years. But if macOS is not your thing, you can find similar tools for other platforms like system-monitor-next for Gnome.
Unfortunately, these monitors only help if you develop on your local machine—a workflow that’s becoming exceedingly rare. If, instead, you SSH into remote virtual machines to do your development or use VSCode’s remote features, you’ll need a different answer.
This is a situation I face right now. The modern ThinkStation I have in the garage is well-equipped with useful lights… but I only access it over SSH for development so those lights and its disk noises are kinda useless from where I sit.
And I’m not sure what the right answer here is. If you have been around for a while, you may remember GKrellM, which I was an avid user of. This system monitor had the ability to display remote machine activity and I’d love to have that again.
